Boost Your Portfolio with Stock Picks

  • Checkmark Follow the collective wisdom of leading investors
  • Checkmark Minimize risk: Individual investors make mistakes, but the consensus reduces them
  • Checkmark Every quarter: 5 handpicked stocks top investors are buying now
  • Checkmark 
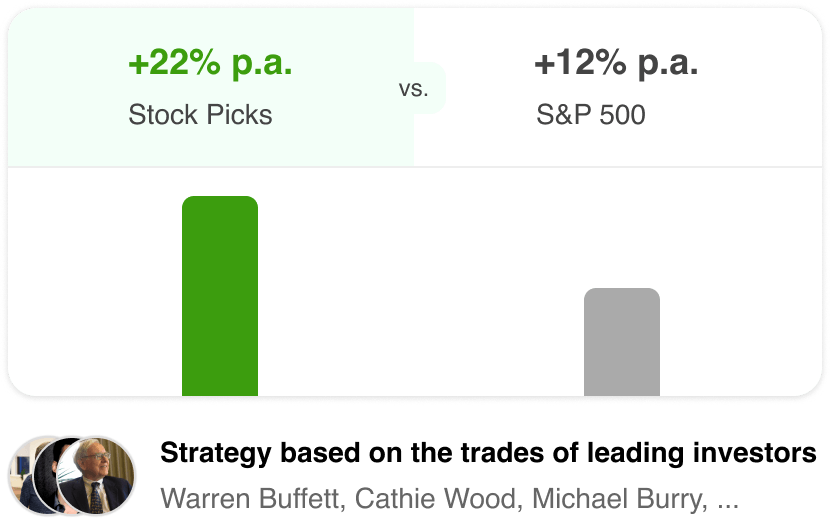
Target ~10% higher annual returns than the S&P 500
  • Checkmark Compound power: $100k invested 10 years ago would be ~$600k now (vs. $300k)
  • Checkmark Invest Like the Pros – Without the Research
Get Started

Join 50,000+ Stockcircle users

Stock Picks
Less ads

Collective Wisdom of Top Investors

The market behaves like an information network where top investors understand the moves best. We track many of these investors to harness their combined insight.

Less ads

Intelligent Risk Reduction

By leveraging deep research and adapting when conditions change, we reduce the impact of any single mistake to aim for higher, market‑beating returns.

Less ads

Outperform the S&P 500

Beat the S&P 500 with just 5 handpicked stocks each quarter and hold them for one year, following a strategy that has historically targeted around +22% average annual returns.

Less ads

Benefit from compound interest

If you had invested $10,000 in Stockcircle stock picks 10 years ago, it would be worth about six times its value now, compared to just three times with the S&P 500.

Historical Performance Track Record

See how our stock picks have performed against the S&P 500 over time

Info
The performance data shows backtested results based on buying all 5 stock picks each quarter and holding them for exactly one year before selling.

Note: The Stock Picks return calculation does not include dividends (due to limited historical data availability).
Year Quarter Stock Picks Return
(1 Year)
S&P 500 Return
(1 Year)
Outperformance
2025
Stock Picks -4.5%
S&P 500 23.3%
Difference -27.9%
Q1 -4.5% 23.3% -27.9%
2024
Stock Picks 12.3%
S&P 500 12.9%
Difference -0.6%
Q4 10.3% 13.0% -2.6%
Q3 20.1% 12.3% +7.9%
Q2 7.4% 14.4% -7.0%
Q1 11.3% 11.9% -0.5%
2023
Stock Picks 57.8%
S&P 500 27.1%
Difference +30.7%
Q4 33.4% 23.5% +10.0%
Q3 64.9% 30.1% +34.8%
Q2 89.3% 28.2% +61.1%
Q1 43.5% 26.7% +16.8%
2022
Stock Picks 47.0%
S&P 500 12.1%
Difference +34.9%
Q4 75.2% 24.5% +50.8%
Q3 81.4% 14.7% +66.7%
Q2 17.4% 1.9% +15.4%
Q1 13.9% 7.4% +6.5%
2021
Stock Picks -27.8%
S&P 500 -8.5%
Difference -19.3%
Q4 -17.9% -8.1% -9.7%
Q3 -37.4% -15.7% -21.7%
Q2 -28.2% -4.0% -24.2%
Q1 -27.9% -6.2% -21.7%
2020
Stock Picks 21.5%
S&P 500 28.6%
Difference -7.0%
Q4 -25.9% 11.1% -37.0%
Q3 44.8% 31.1% +13.7%
Q2 42.4% 31.1% +11.2%
Q1 24.8% 40.8% -15.9%
2019
Stock Picks 33.1%
S&P 500 12.3%
Difference +20.8%
Q4 45.3% 14.9% +30.4%
Q3 38.6% 14.2% +24.4%
Q2 49.5% 15.4% +34.1%
Q1 -0.9% 4.6% -5.5%
2018
Stock Picks 9.0%
S&P 500 10.8%
Difference -1.8%
Q4 9.6% 21.1% -11.5%
Q3 32.8% 15.8% +16.9%
Q2 7.1% 1.5% +5.6%
Q1 -13.3% 4.8% -18.1%
2017
Stock Picks 19.2%
S&P 500 9.3%
Difference +9.9%
Q4 11.0% 2.4% +8.6%
Q3 0.8% 2.3% -1.5%
Q2 29.9% 17.8% +12.1%
Q1 35.2% 14.8% +20.4%
2016
Stock Picks 34.8%
S&P 500 15.2%
Difference +19.6%
Q4 29.9% 14.9% +15.0%
Q3 39.0% 18.2% +20.7%
Q2 34.2% 11.0% +23.2%
Q1 36.1% 16.8% +19.3%
2015
Stock Picks 7.2%
S&P 500 8.1%
Difference -0.9%
Q4 38.8% 23.3% +15.5%
Q3 -7.9% 5.7% -13.6%
Q2 5.5% 7.2% -1.8%
Q1 -7.4% -3.8% -3.6%
2014
Stock Picks 6.3%
S&P 500 3.1%
Difference +3.2%
Q4 13.2% -8.6% +21.8%
Q3 -7.2% 1.8% -9.0%
Q2 13.6% 6.4% +7.2%
Q1 5.7% 12.9% -7.1%
2013
Stock Picks 28.0%
S&P 500 15.6%
Difference +12.3%
Q4 28.7% 14.9% +13.8%
Q3 31.1% 14.7% +16.5%
Q2 33.1% 20.5% +12.7%
Q1 18.8% 12.4% +6.5%
2012
Stock Picks 17.8%
S&P 500 23.3%
Difference -5.5%
Q4 6.2% 21.2% -15.0%
Q3 33.7% 28.9% +4.8%
Q2 -17.8% 16.5% -34.3%
Q1 49.1% 26.8% +22.3%
2011
Stock Picks 15.7%
S&P 500 11.8%
Difference +3.8%
Q4 12.5% 11.0% +1.6%
Q3 35.8% 14.2% +21.7%
Q2 21.2% 24.0% -2.9%
Q1 -6.9% -1.9% -5.0%
2010
Stock Picks 2.6%
S&P 500 6.3%
Difference -3.8%
Q4 9.8% 1.4% +8.3%
Q3 11.8% 1.7% +10.1%
Q2 -20.9% 1.6% -22.5%
Q1 9.7% 20.7% -11.0%
2009
Stock Picks 12.2%
S&P 500 7.5%
Difference +4.7%
Q4 9.5% 21.5% -11.9%
Q3 4.3% 8.5% -4.1%
Q2 1.8% 0.0% +1.8%
Q1 33.0% 0.0% +33.0%

Disclaimer: Past performance doesn't predict future performance. Read more