12 Chuck Akre Adobe Trades
The first Adobe trade was made in Q1 2020. Since then Chuck Akre bought shares six more times and sold shares on five occasions. The investor completely sold their stake between Q4 2022 and Q3 2023.
Avg closing price
Price range
Sold -1.06M shares
Q3 2023
Avg closing price
$524.63
Price range
$481.29
-
$564.88
Sold 11.3% shares (-135k shares)
Q2 2023
Avg closing price
$402.84
Price range
$335.45
-
$495.18
Sold 3.3% shares (-40.5k shares)
Q1 2023
Avg closing price
$355.42
Price range
$320.54
-
$392.23
Sold 25.6% shares (-426k shares)
Q4 2022
Avg closing price
$319.83
Price range
$284.83
-
$345.96
Increased shares by 0.3% (+5.5k shares)
Q3 2022
Avg closing price
$378.38
Price range
$275.20
-
$451.02
Increased shares by 6.0% (+93.3k shares)
Q2 2022
Avg closing price
$406.98
Price range
$360.79
-
$468.81
Increased shares by 2.4% (+37k shares)
Q1 2022
Avg closing price
$481.10
Price range
$411.50
-
$564.37
Increased shares by 0.0% (+105 shares)
Q4 2021
Avg closing price
$625.08
Price range
$549.77
-
$688.37
Sold 0.0% shares (-105 shares)
Q3 2021
Avg closing price
$629.41
Price range
$575.72
-
$666.59
Increased shares by 0.0% (+220 shares)
Q2 2021
Avg closing price
$515.47
Price range
$472.09
-
$590.75
Increased shares by 34.2% (+390k shares)
Q1 2021
Avg closing price
$467.43
Price range
$421.20
-
$501.64
New holding (+1.14M shares)
Q1 2020
Avg closing price
$342.05
Price range
$285.00
-
$383.28
News about Adobe Inc and Chuck Akre
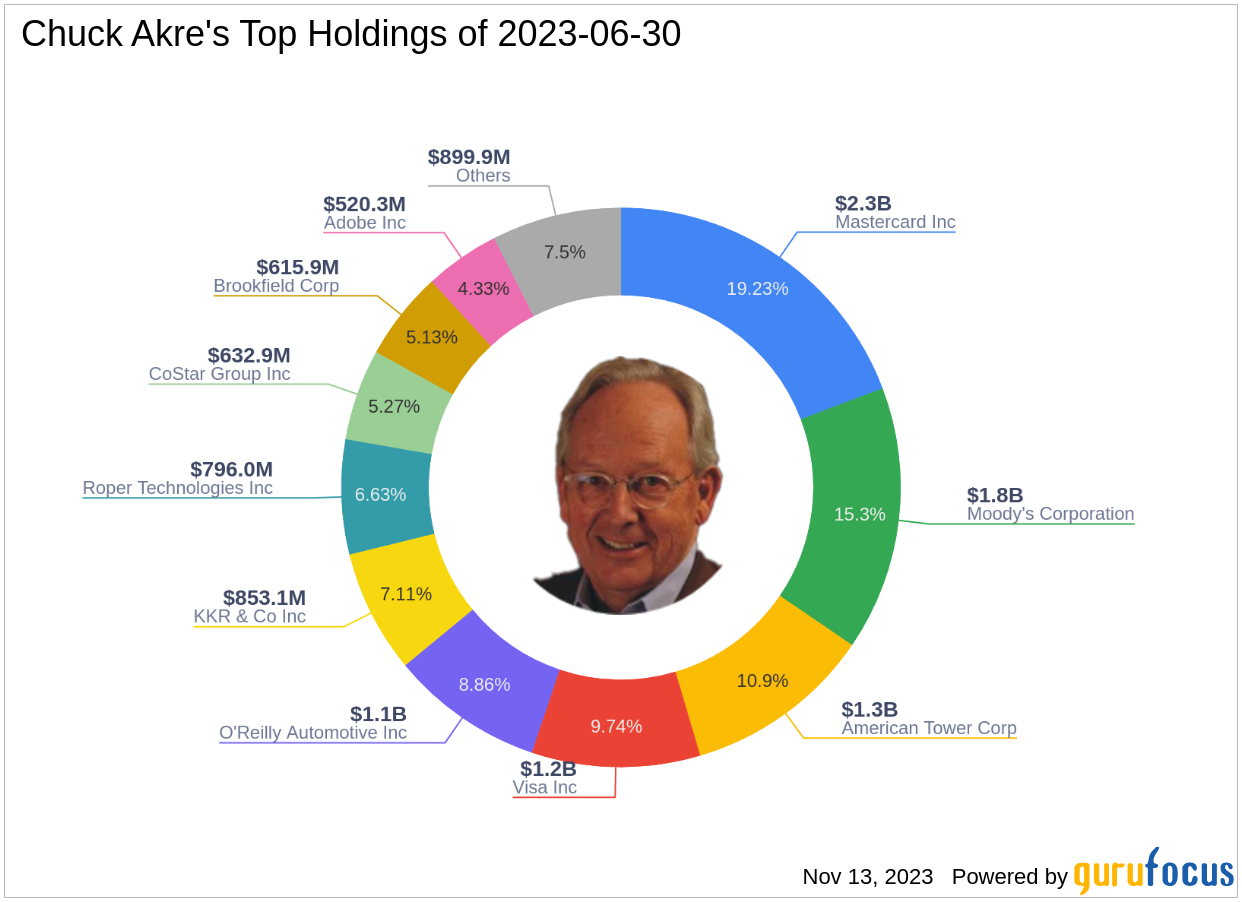
Chuck Akre''s Investment Strategy Leads to Major Changes in Portfolio with Adobe Inc Exit
Chuck Akre''s Investment Strategy Leads to Major Changes in Portfolio with Adobe Inc Exit
Should You Remain Confident with Your Adobe (ADBE) Shares?
Akre Capital Management, an investment management firm, published its “Akre Focus Fund” third-quarter 2022 investor letter – a copy of which can be downloade...