20 Paul Tudor Jones II Berkshire Hathaway Trades
Paul Tudor Jones II acquired 127k Berkshire Hathaway shares worth $51.5M. The first Berkshire Hathaway trade was made in Q3 2013. Since then Paul Tudor Jones II bought shares nine more times and sold shares on ten occasions.
News about Berkshire Hathaway Inc. - Ordinary Shares - Class B and Paul Tudor Jones II
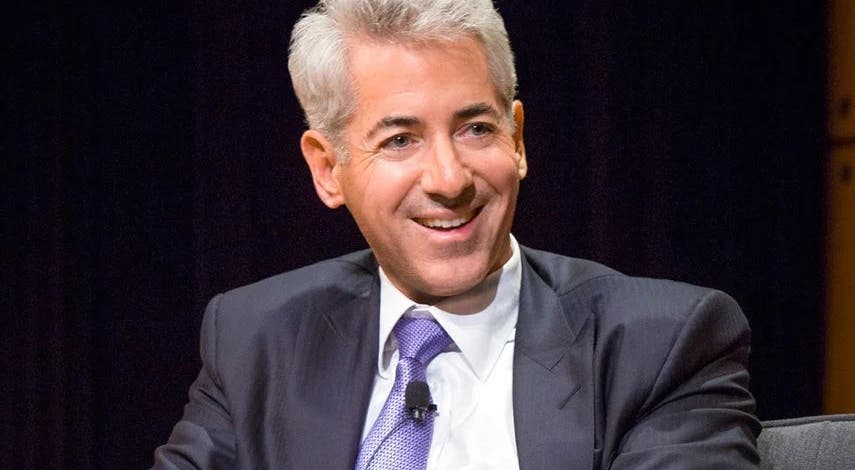
Bill Ackman Reveals First Investment Book He Read Was The Same One That Influenced Warren Buffett: ''It Was Kind Of The Inspiration For My Career…''
The founder of Pershing Square Capital Management , Bill Ackman , has revealed that the book “The Intelligent Investor” by Benjamin Graham was the catalyst f...

Govt rejects Chinese BYD Motors’ plan to build EV plant
As the government gears up to welcome Elon Musk’s Tesla to set up a supply chain ecosystem in the country in the foreseeable future, the Centre has reportedl...

Commercial And Service Industry Machinery Global Market Report 2022
Major companies in the commercial and service industry machinery market include Canon Inc, Sunny Optical Technology Company Limited, Berkshire Hathaway Inc, ...

Atlas Capital Advisors Llc Buys Vanguard FTSE Europe ETF, S&P 500 ETF TRUST ETF, Vanguard ...
Related Stocks: VGK , SPY , VHT , SCHC , FTEC , IMTM , IJS , BKLN , BIIB , NVO , ABB , 9984 , MSFT , VTV , BABA , BAB , PODD , BRK.A , MOS , SFTBF , PBCT , E...